After more than two years of building up our framework and posting free bi-weekly updates on our ShaleProfile.com blog, we are very pleased to announce the very first release of our ShaleProfile Analytics portal.
on Monday the 23rd of July
Whether you want to understand true operator performance, compare productivity profiles and changes over time, or understand what is really driving the increases in productivity (lat length? Prop volume?): our dashboards aim to make it easy for you to analyze our data and get these key questions answered.
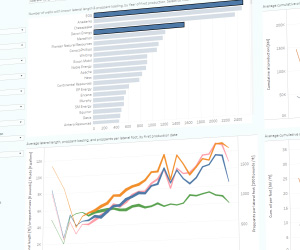
All our map views and analytic plots are interactively linked. Selections made geographically are automatically carried on to the analysis plots you selected to view. From shale play level to individual wells can be viewed. Subsets – data points - in your analytics plots can be selected, these are subsequently highlighted on your map. Global filters ensure your regional or operator preferences are set for each view, and your favorite dashboards are quick to recall.
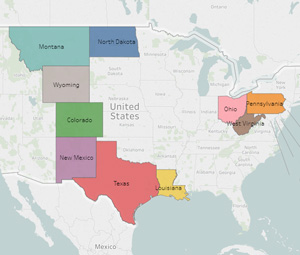
ShaleProfile Data holds over 80,000 horizontal wells over 10 US states, access to this data can be purchased via a subscription model on our website. Historical production, location data (laterals), completion details, proppant volumes, and more.
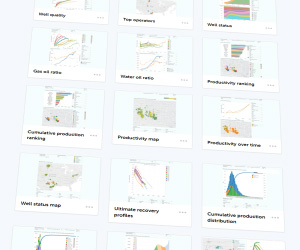
A ShaleProfile Analytics subscription gives you access to our ever growing set of dashboards to help answer your questions on the shale developments in the US.
Ready to try it?
Fill in the form below to submit a trial request, and someone from the ShaleProfile team will be in contact with you to setup your trial account| © 2018 ShaleProfile. All Rights Reserved. | Follow us on social media |


|